
Updated
Through Feb 2025
(periodic updates)
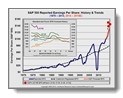
Earnings Trends: History & Future
This graph presents both (1) the historical trend for actual reported earnings per share (EPS), including a forecast by Standard & Poors, and (2) an inset graph presenting the historical record for S&P’s forecast over the past five years. To put the historical trend and future forecast into perspective, the graph includes Crestmont’s assessment of the long-term baseline trend for EPS. Crestmont’s baseline also puts into perspective whether current and forecast EPS are above or below the long-term trend for EPS.
Note: the inset graph reflects S&P’s EPS forecasts for recent years; forecasts begin about two years in advance and proceed until the year is finalized.